Time-Varying Effect Modeling for the Behavioral, Social, and Health Sciences
Book Companion Website
Welcome to the book companion website for “Time-Varying Effect Modeling for the Behavioral, Social, and Health Sciences” by Stephanie Lanza, Ph.D. and Ashley Linden-Carmichael, Ph.D.!
Below, you will find an image of each of the figures presented in our book by chapter. After clicking on each image, you will find the equation and SAS syntax used to generate each of these figures. You may copy and modify it for use in your own work. If you navigate to our main TVEM page above, you will find a variety of resources, including links to a SAS macro for conducting TVEM and its corresponding users’ guide. We also provide a recommended reading list.
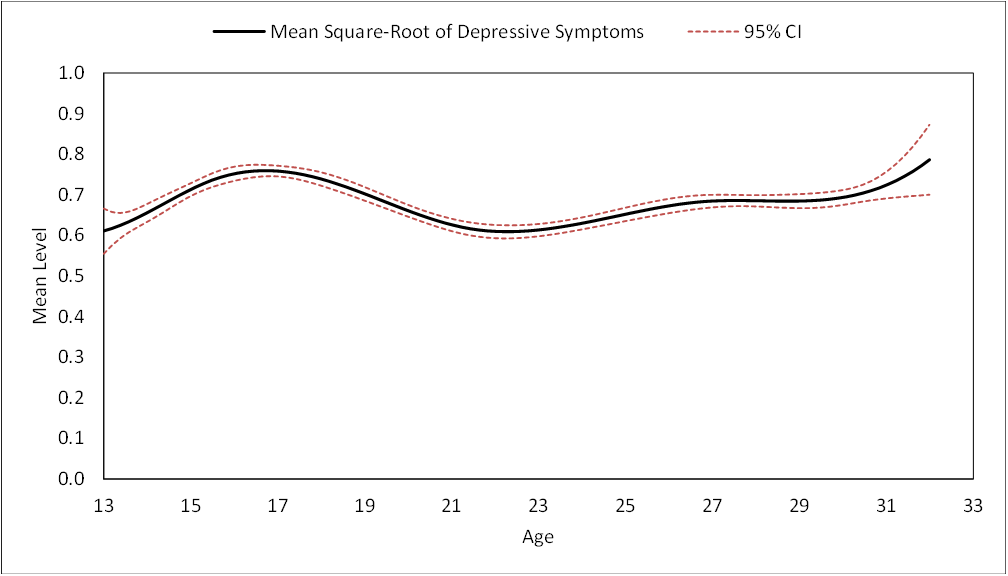
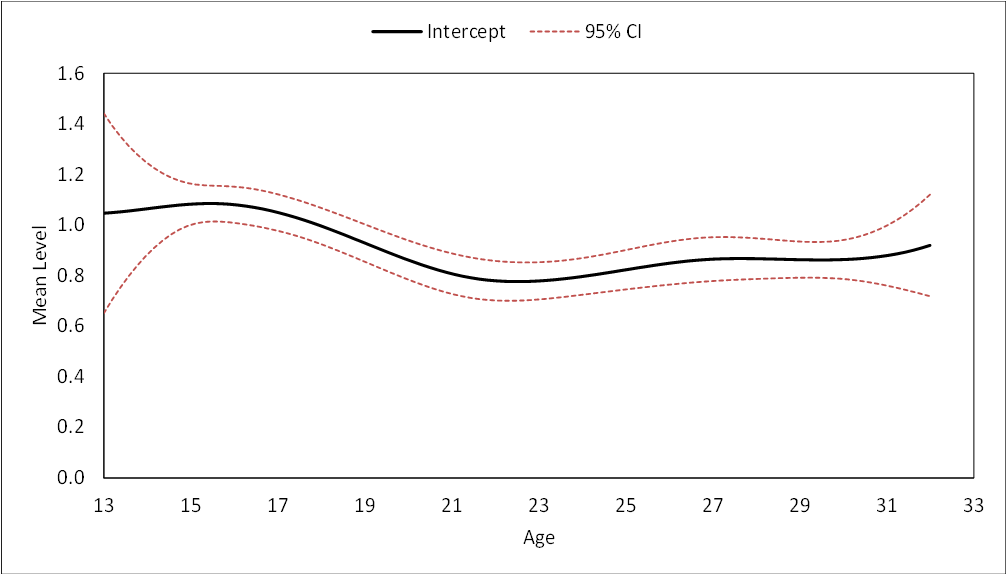
Figure 2.2a
Coefficient functions from main effect model predicting depressive symptoms across ages 13 to 32 years.
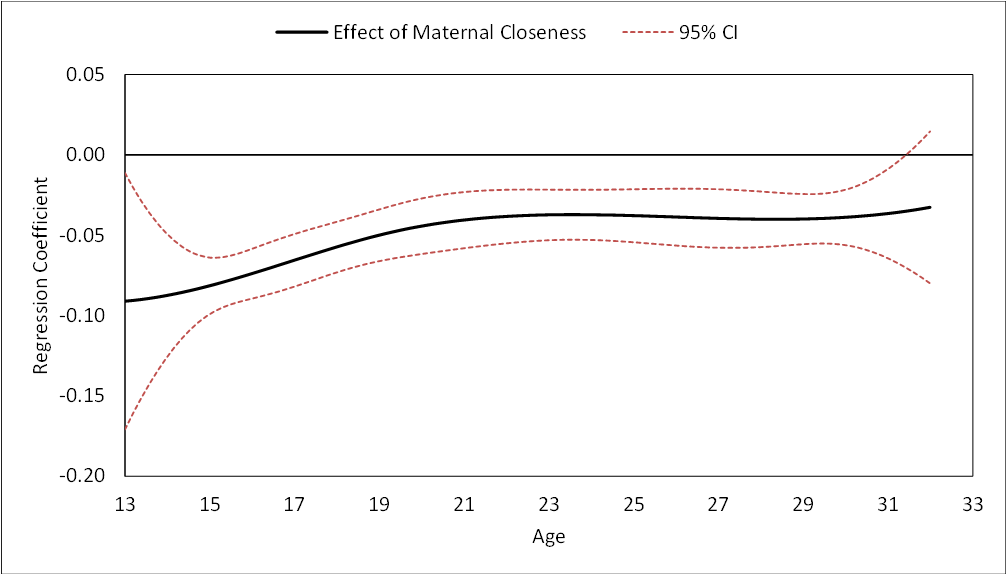
Figure 2.2b
Coefficient functions from main effect model predicting depressive symptoms across ages 13 to 32 years.
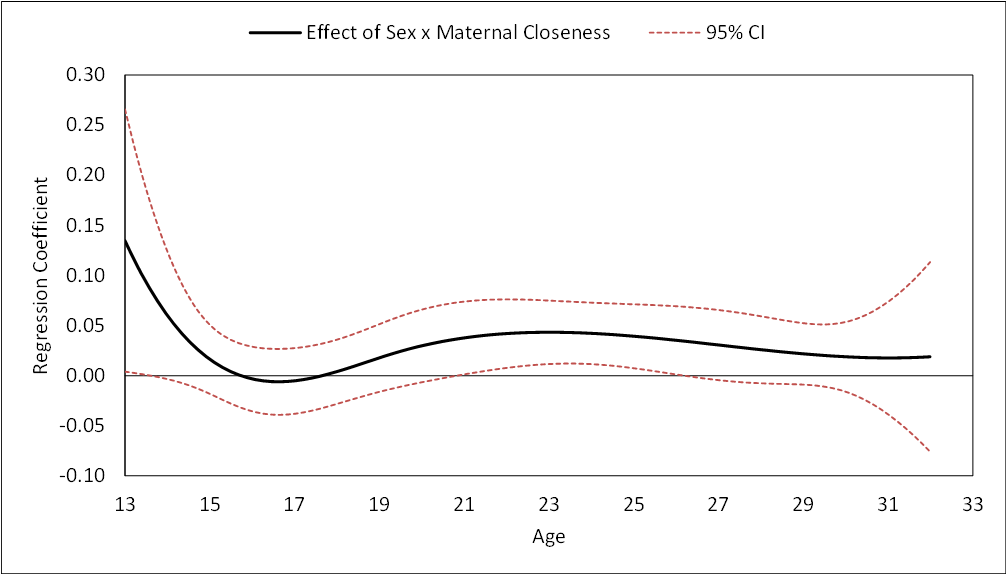
Figure 2.3
Coefficient function for term representing the interaction between sex and maternal closeness in predicting depressive symptoms across ages 13 to 32 years.
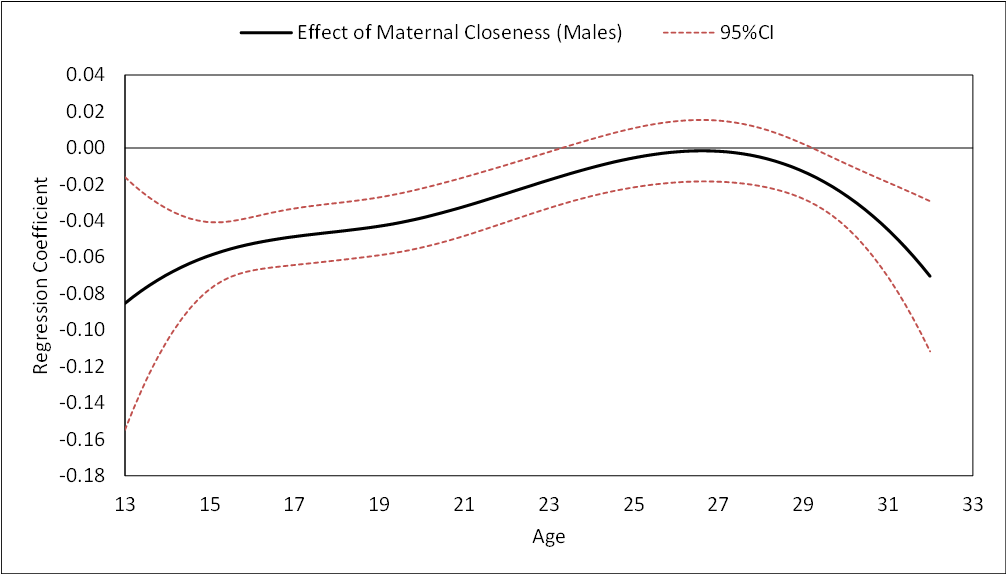
Figure 2.4a
Simple slopes showing the association between maternal closeness and depressive symptoms for males(a) and females(b).
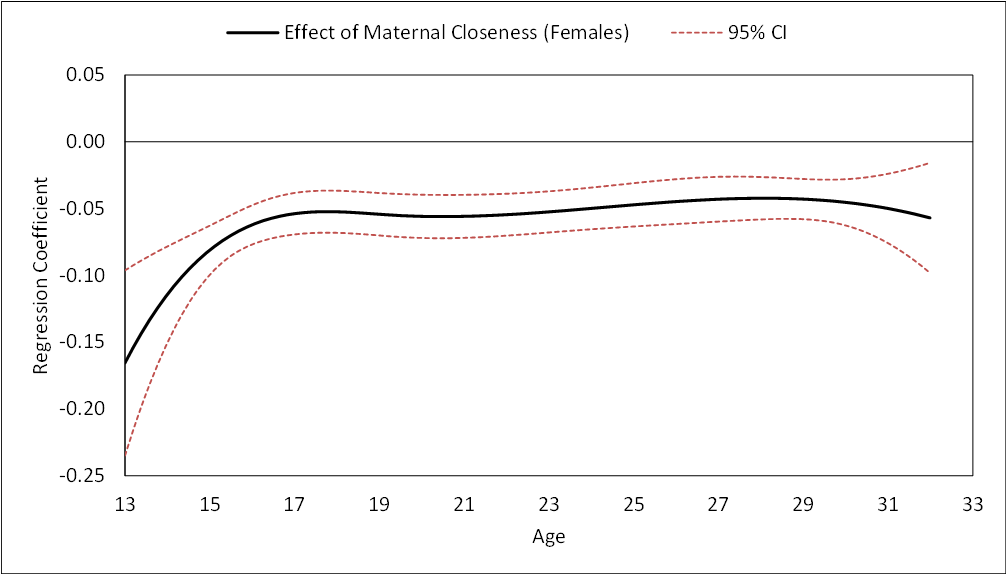
Figure 2.4b
Simple slopes showing the association between maternal closeness and depressive symptoms for males(a) and females(b).
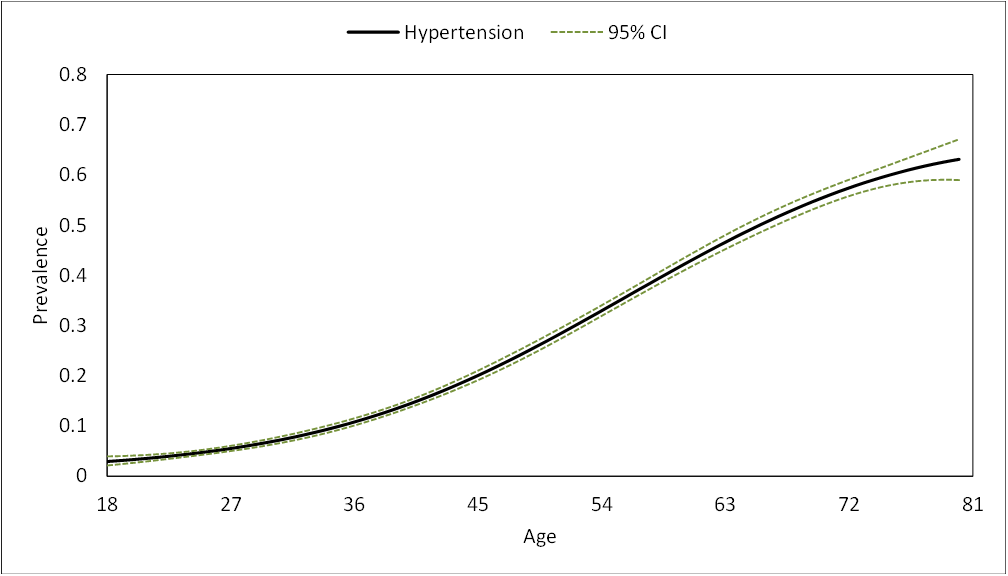
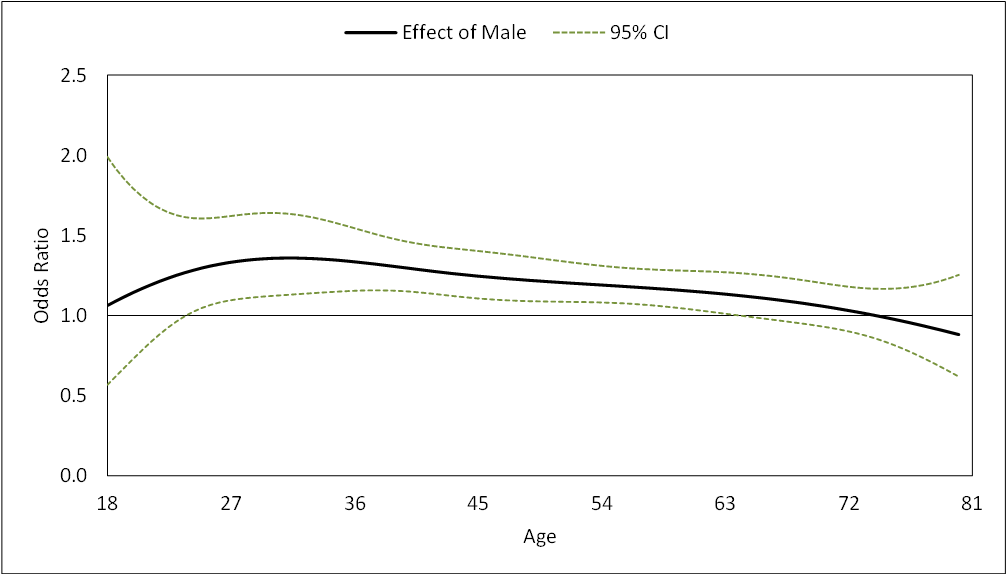
Figure 3.3a
Odds ratio corresponding to the change in odds of hypertension associated with being male across age.
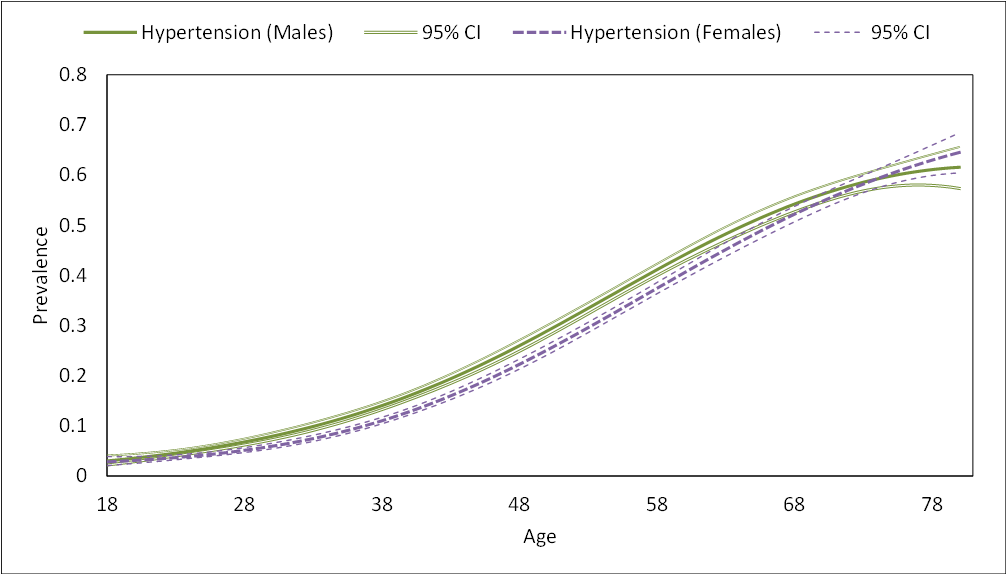
Figure 3.3b
Estimated prevalence of past-year hypertension and corresponding 95% confidence interval across age, separately by male and female.
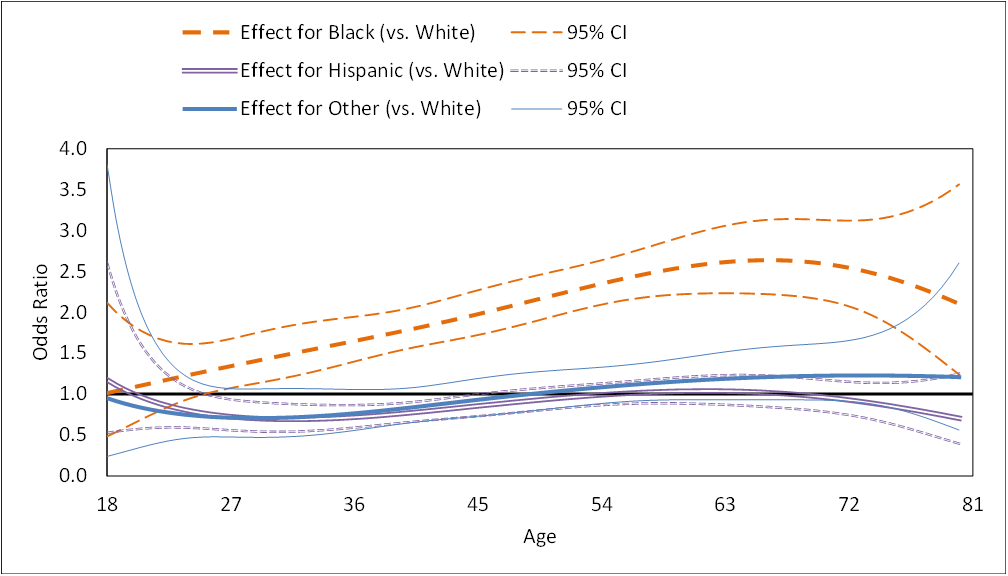
Figure 3.4a
Odds ratio corresponding to the change in odds of hypertension associated with being Black, Hispanic/Latinx, or Other racial/ethnic group relative to White adults across ages 18 to 80.
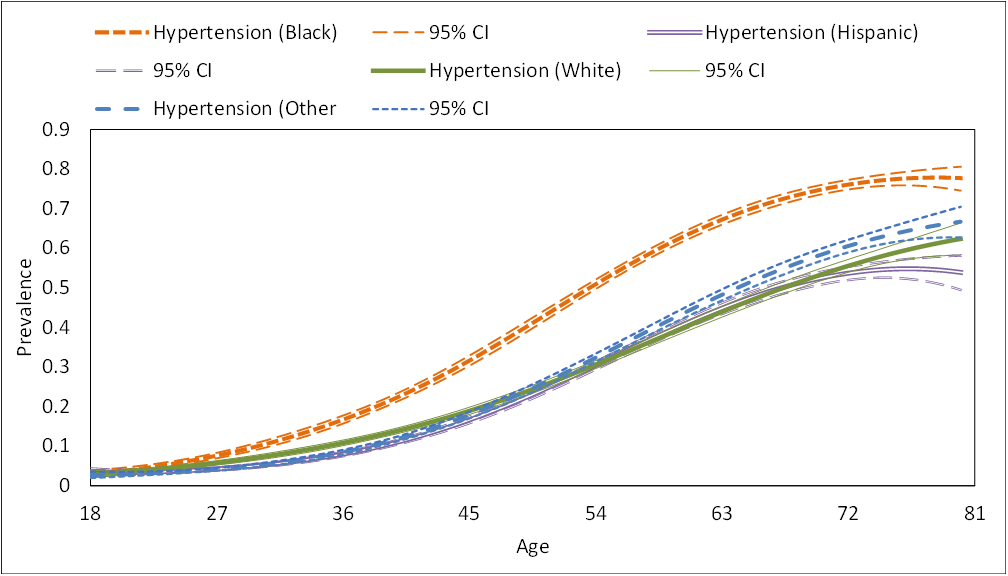
Figure 3.4b
Estimated prevalence of past-year hypertension across age separately for Black, Hispanic/Latinx, White, and Other racial/ethnic groups of adults.
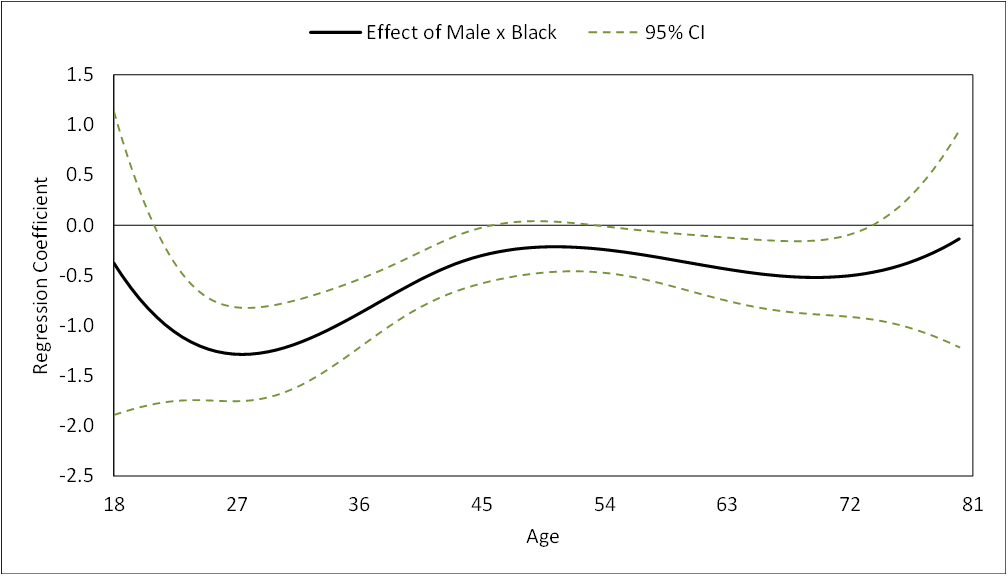
Figure 3.5a
Coefficient functions corresponding to the interaction between the indicator of being male and indicators of being (a) Black, (b) Hispanic/Latinx, and (c) Other racial/ethnic group on past-year hypertension across age.
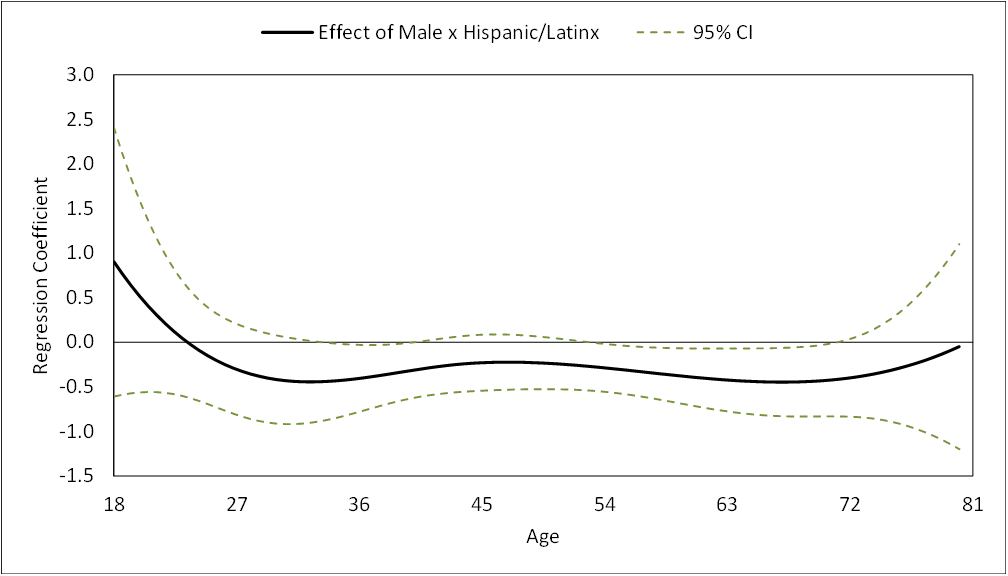
Figure 3.5b
Coefficient functions corresponding to the interaction between the indicator of being male and indicators of being (a) Black, (b) Hispanic/Latinx, and (c) Other racial/ethnic group on past-year hypertension across age.
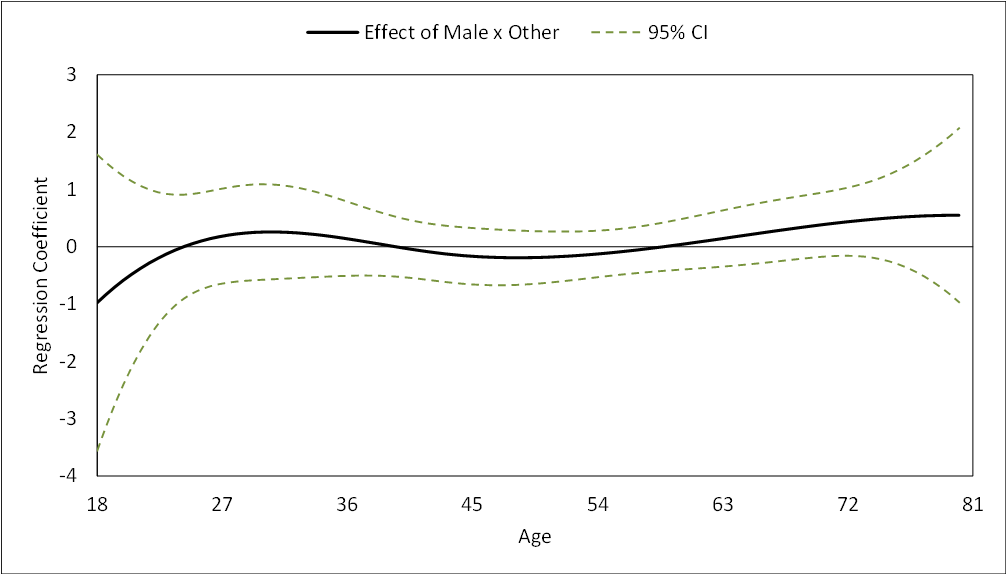
Figure 3.5c
Coefficient functions corresponding to the interaction between the indicator of being male and indicators of being (a) Black, (b) Hispanic/Latinx, and (c) Other racial/ethnic group on past-year hypertension across age.
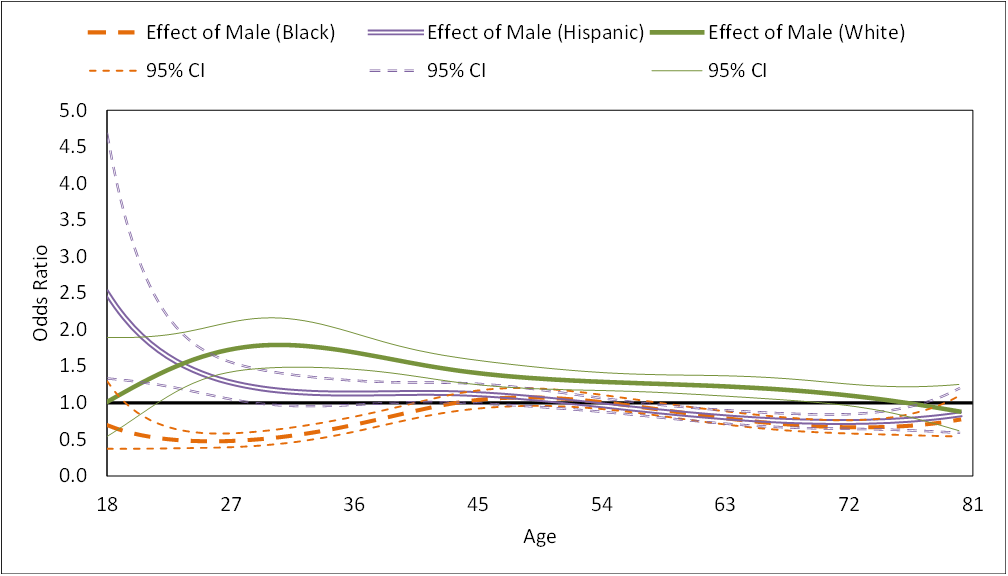
Figure 3.6
Age-varying odds ratios showing the effect of being male on past-year hypertension among Black, Hispanic/Latinx, and White adults.
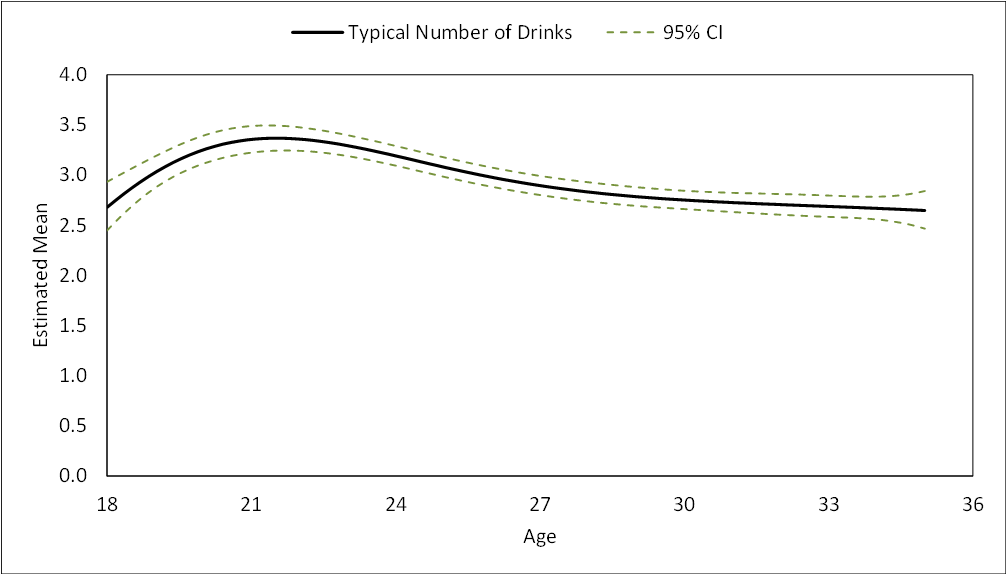
Figure 3.7
Estimated mean number of alcoholic drinks consumed during a typical occasion in the past year as a function of age, derived by exponentiating the intercept function in logistic TVEM.
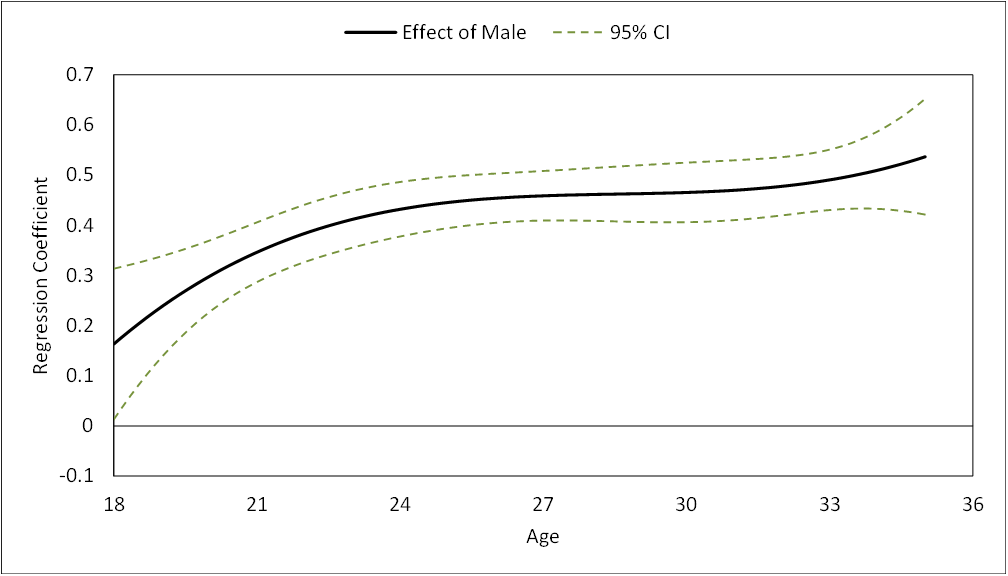
Figure 3.8a
Age-dependent sex difference (i.e., the effect of being male) in the log-mean number of drinks consumed during a typical occasion across age.
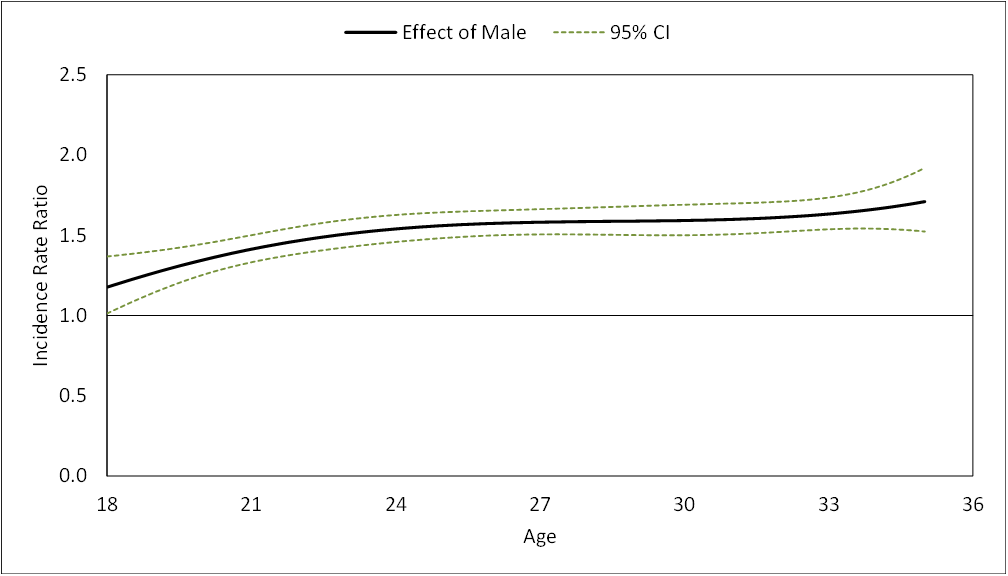
Figure 3.8b
Incidence rate ratio representing age-dependent sex difference in the mean number of drinks consumed during a typical occasion across age.
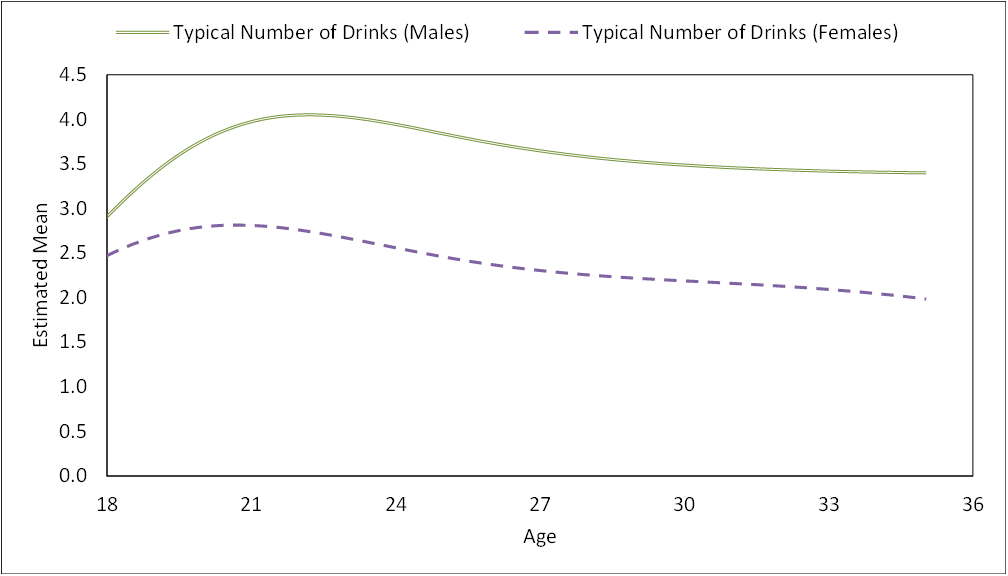
Figure 3.8c
Estimated mean number of drinks consumed during a typical occasion across age separately for males and females.
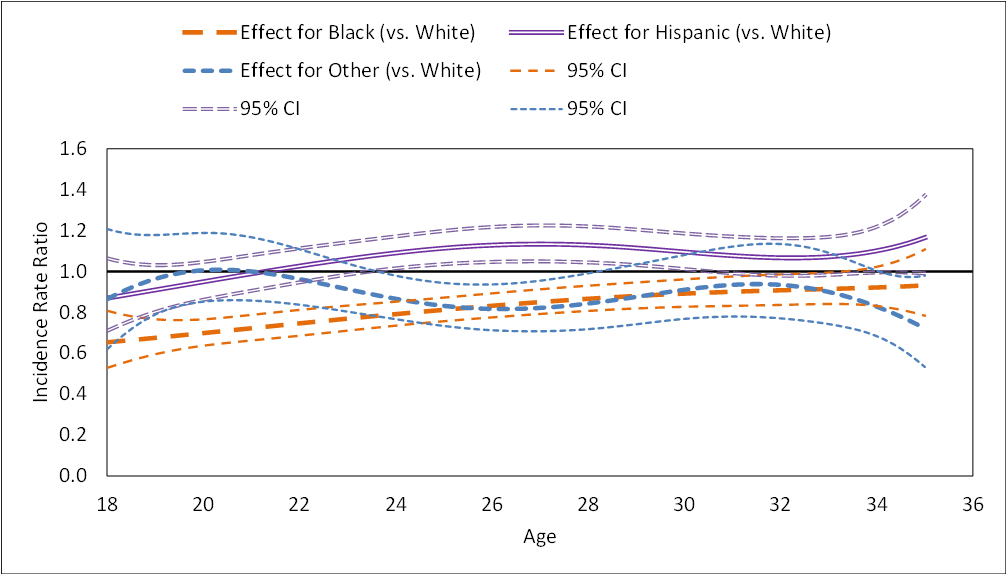
Figure 3.9a
Incidence rate ratios representing the association between race/ethnicity and the mean number of drinks consumed during a typical occasion across age.
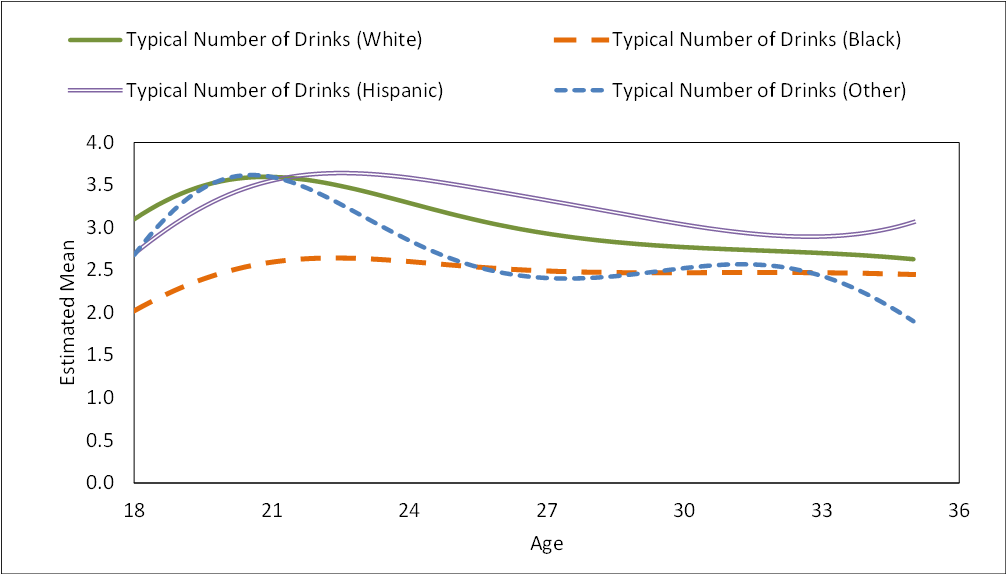
Figure 3.9b
Estimated mean number of drinks consumed during a typical occasion across age for each racial/ethnic group.
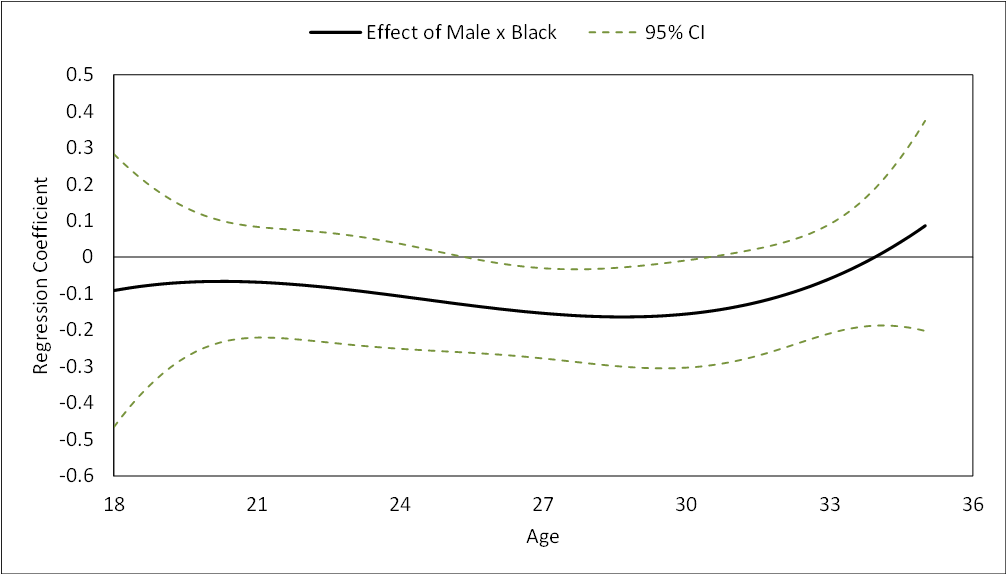
Figure 3.10a
Coefficient functions corresponding to the interaction between the indicator of being male and indicators of being (a) Black, (b) Hispanic/Latinx, and (c) Other racial/ethnic group on mean number of drinks during a typical occasion across...
Full Details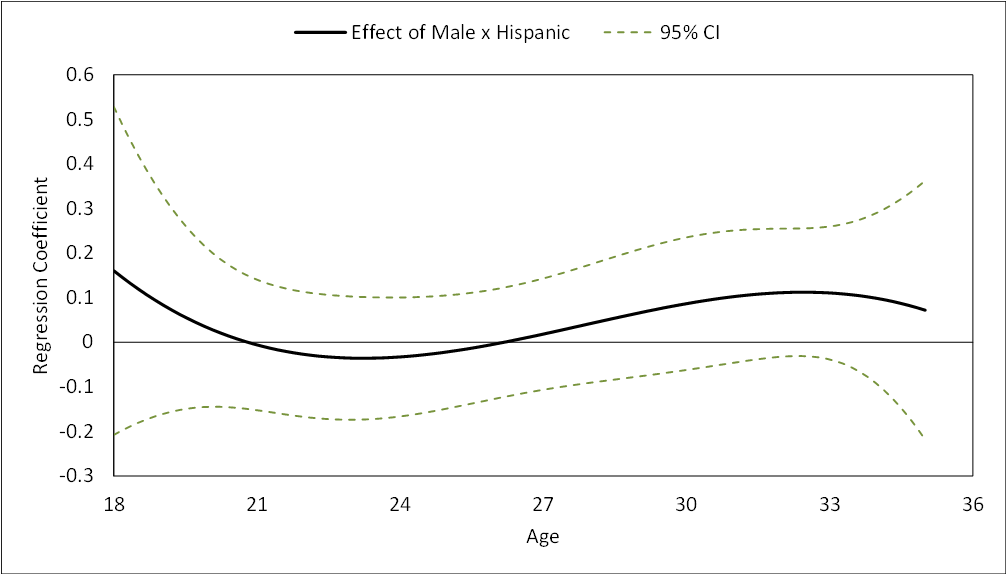
Figure 3.10b
Coefficient functions corresponding to the interaction between the indicator of being male and indicators of being (a) Black, (b) Hispanic/Latinx, and (c) Other racial/ethnic group on mean number of drinks during a typical occasion across...
Full Details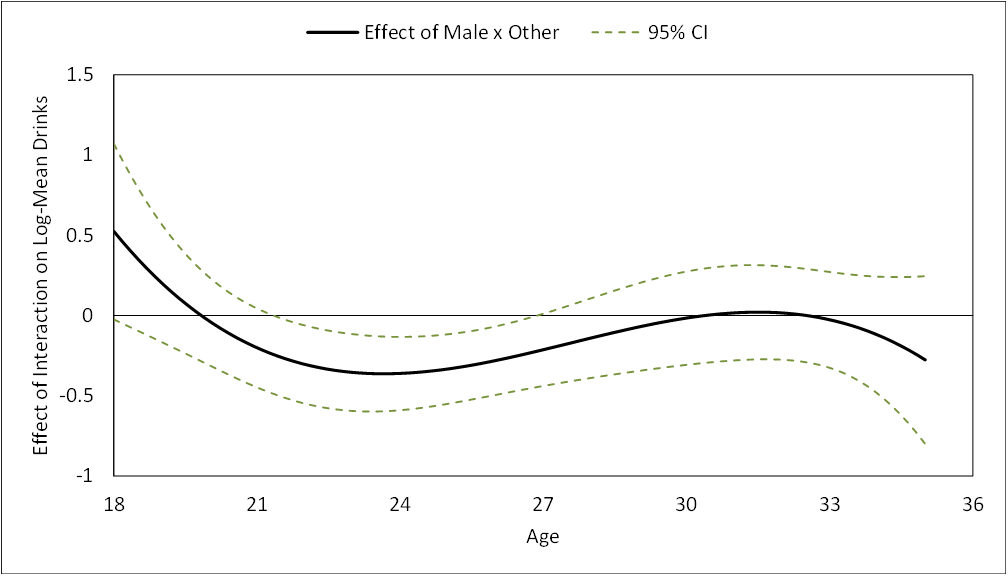
Figure 3.10c
Coefficient functions corresponding to the interaction between the indicator of being male and indicators of being (a) Black, (b) Hispanic/Latinx, and (c) Other racial/ethnic group on mean number of drinks during a typical occasion across...
Full Details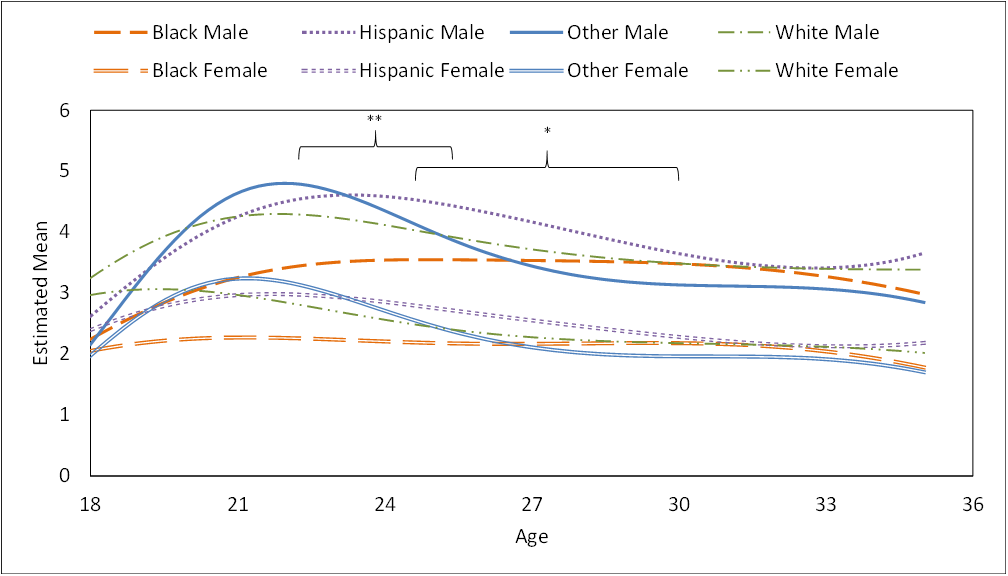
Figure 3.11
Mean number of drinks during a typical occasion across age for sex and racial/ethnic groups.
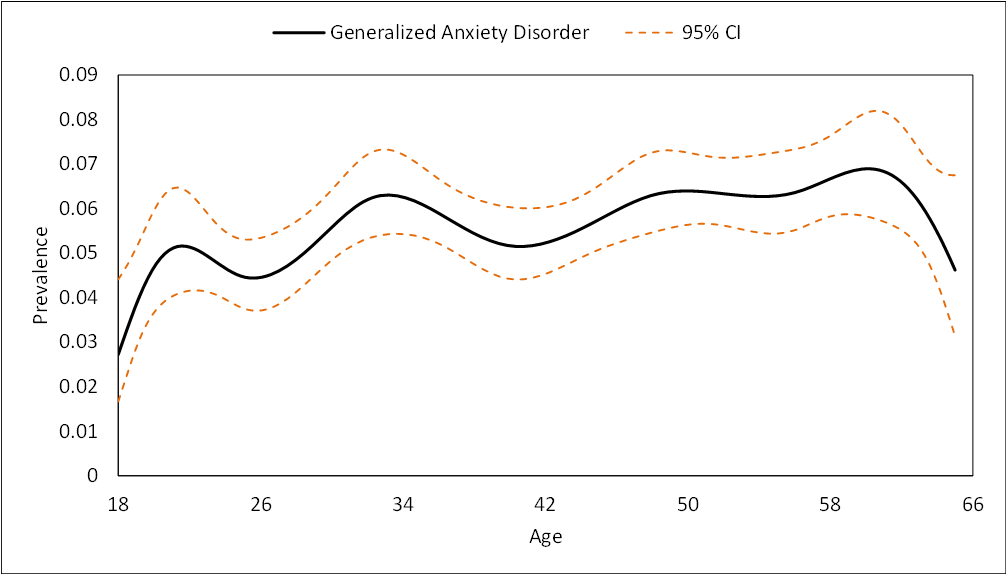
Figure 4.1
Estimated prevalence (with 95% confidence band) of past-year generalized anxiety disorder as a function of continuous age.
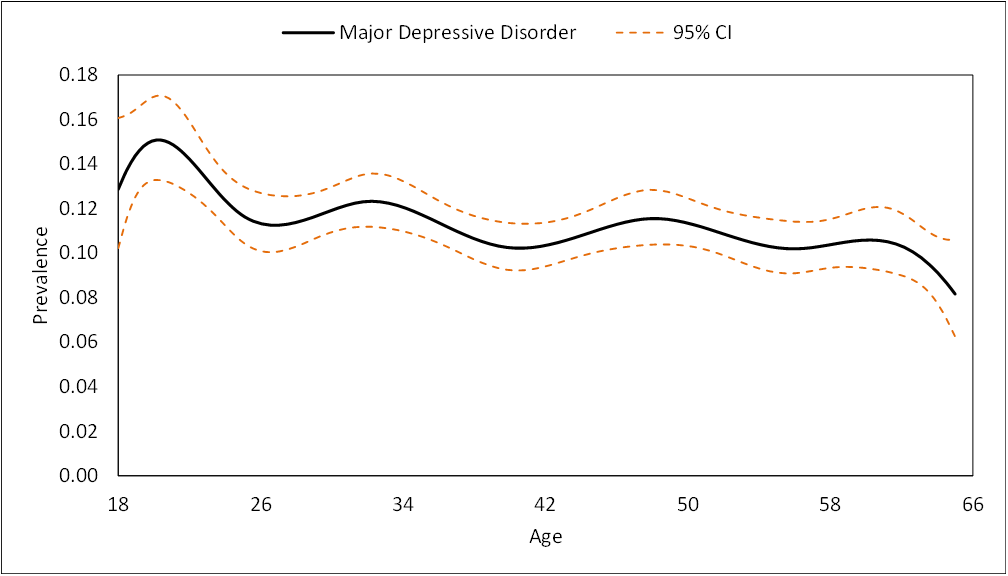
Figure 4.2
Estimated prevalence (with 95% confidence band) of past-year major depressive disorder as a function of continuous age.
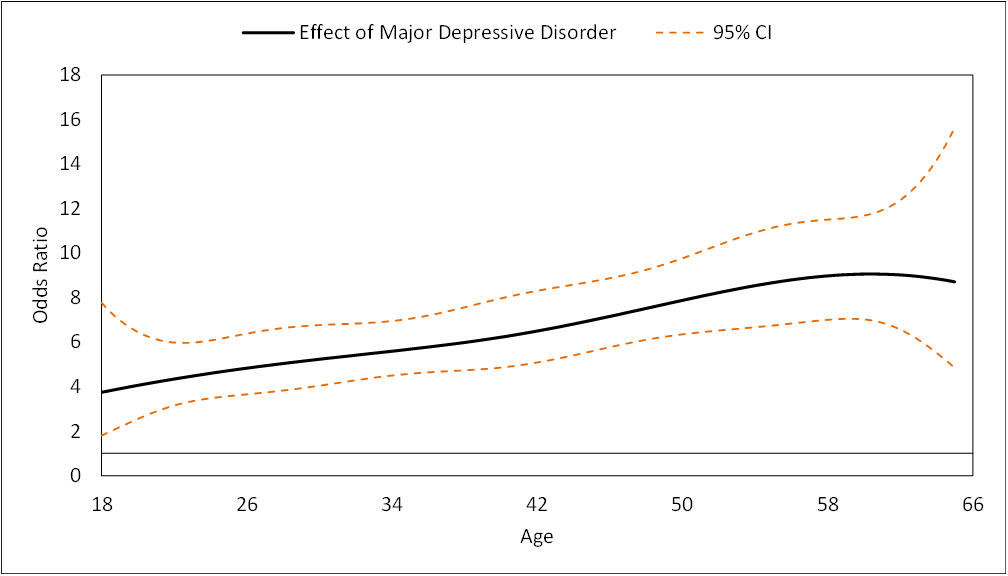
Figure 4.3
Estimated change in odds of meeting criteria for a past-year generalized anxiety disorder (with 95% confidence band) associated with having a past-year major depressive disorder as a function of age.
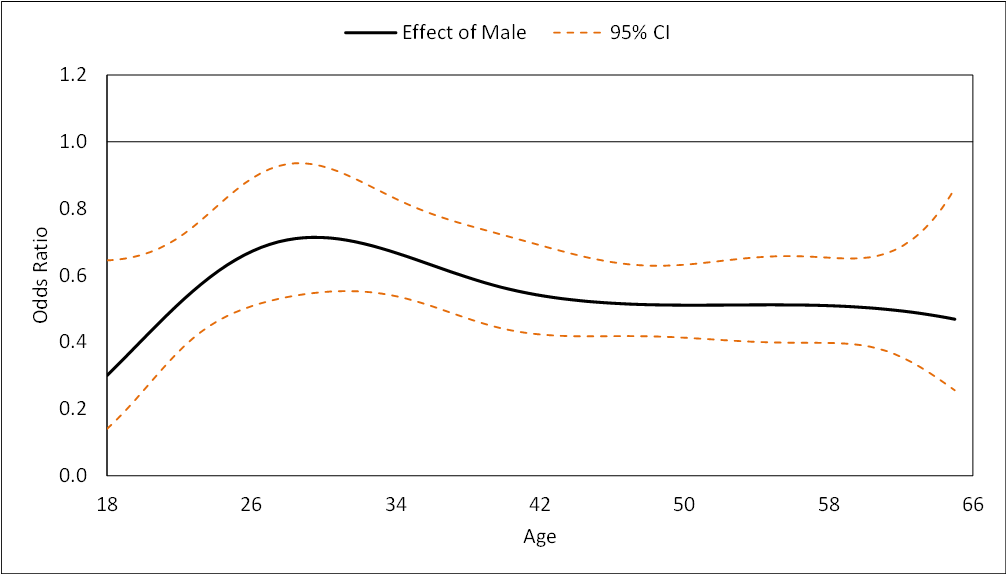
Figure 4.4
Estimated change in odds of meeting criteria for a past-year generalized anxiety disorder (with 95% confidence band) associated with being male as a function of age.
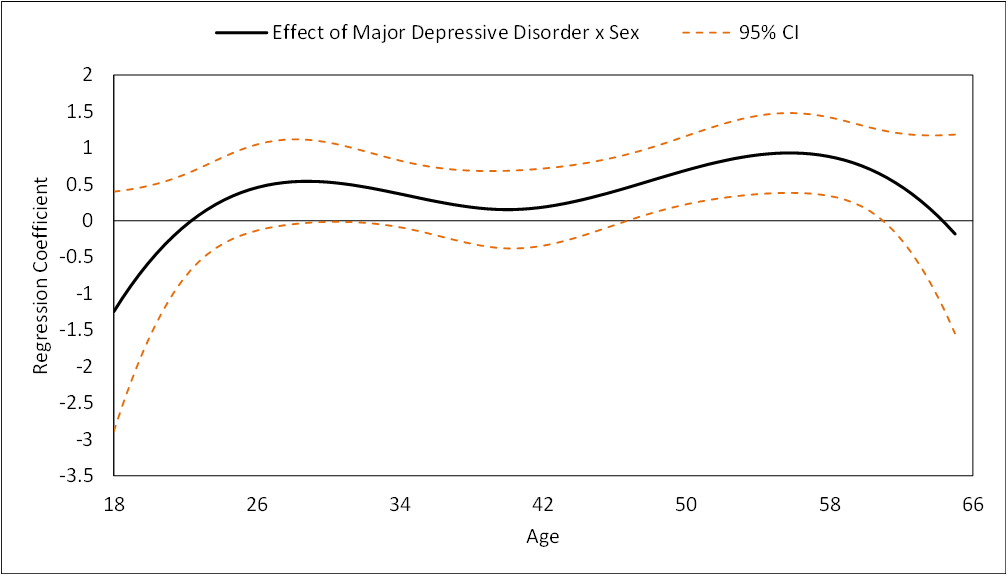
Figure 4.5
Age-varying effect of the interaction between past-year major depressive disorder and sex predicting past-year generalized anxiety disorder as a function of age.
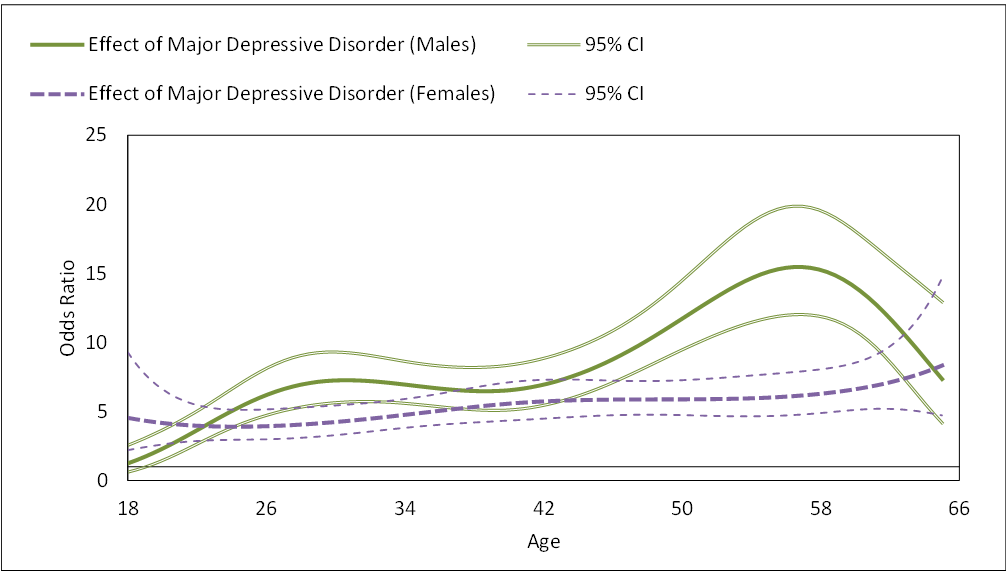
Figure 4.6
The age-varying association between major depressive disorder and generalized anxiety disorder across age separately for male and female adults as a function of age.
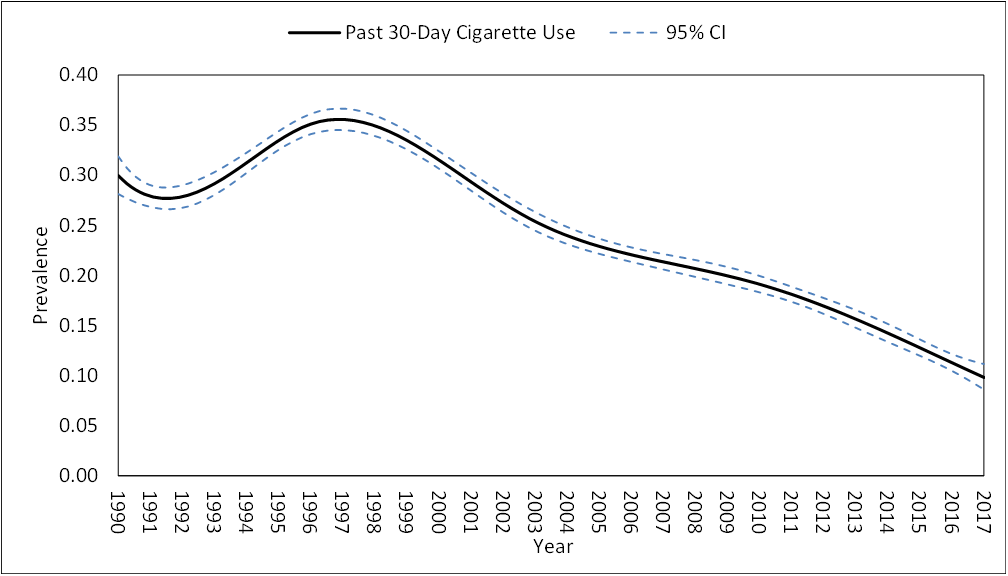
Figure 5.1
Estimated prevalence (with 95% confidence band) of past 30-day cigarette use among high school students as a function of historical time: 1990 – 2017.
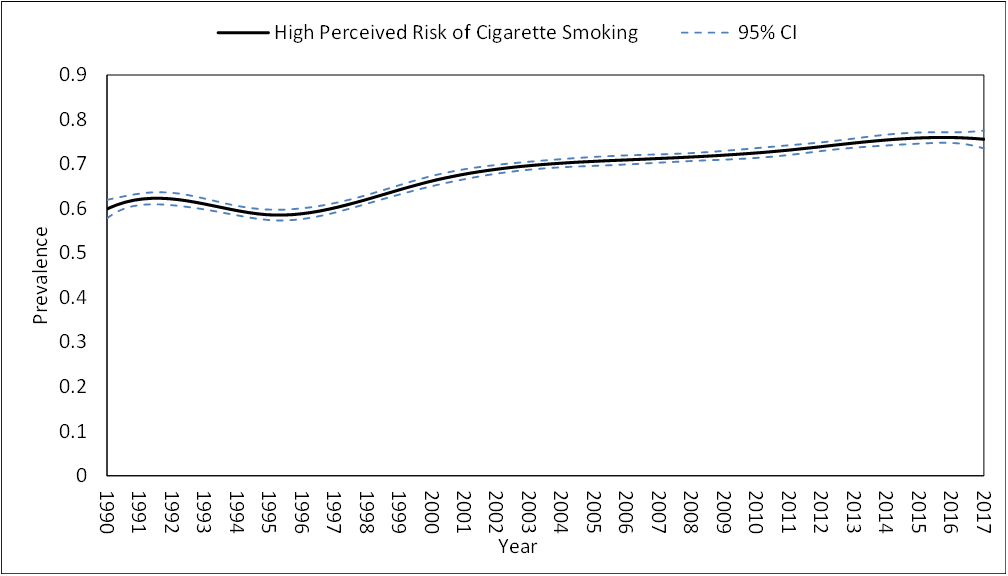
Figure 5.2
Estimated prevalence (with 95% confidence band) of perceived high risk of cigarette use among high school students as a function of historical time: 1990 – 2017.
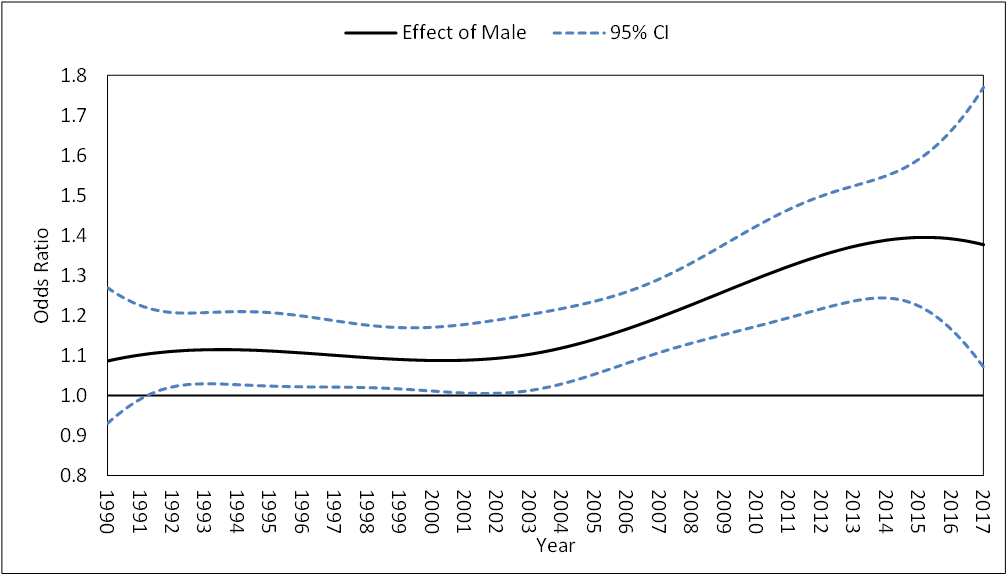
Figure 5.3a
Estimated change in odds of past 30-day cigarette smoking (with 95% confidence band) associated with being male.
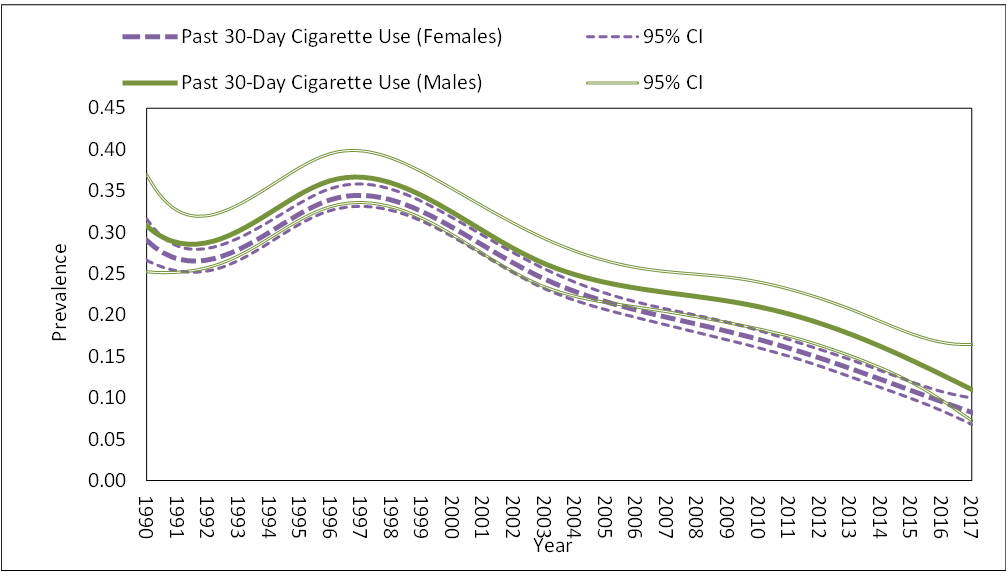
Figure 5.3b
Prevalence of past 30-day cigarette smoking (with 95% confidence band) for female and male high school students as a function of historical time: 1990 – 2017.
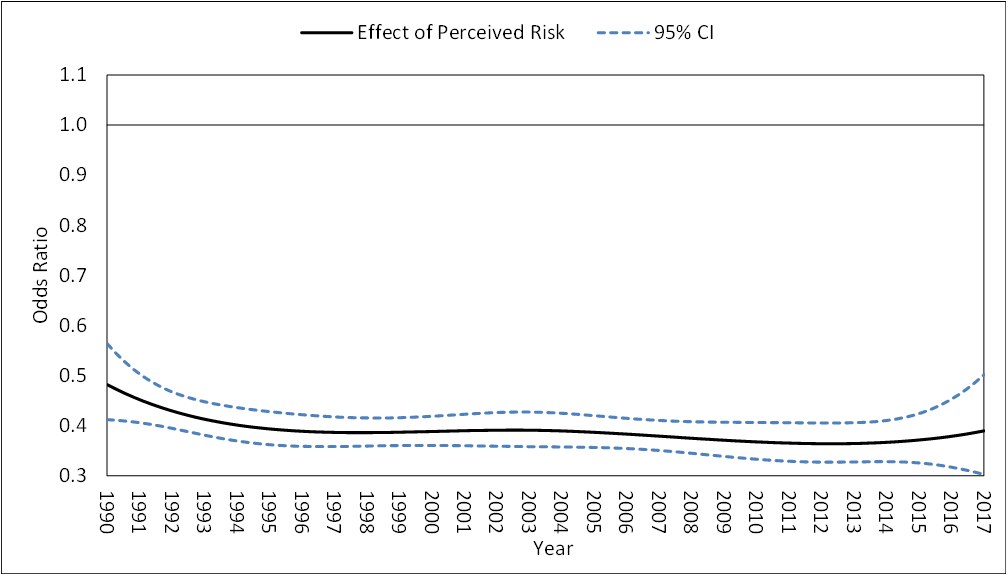
Figure 5.4a
Estimated change in odds of past 30-day cigarette smoking (with 95% confidence band) associated with high perceived risk of cigarette use.
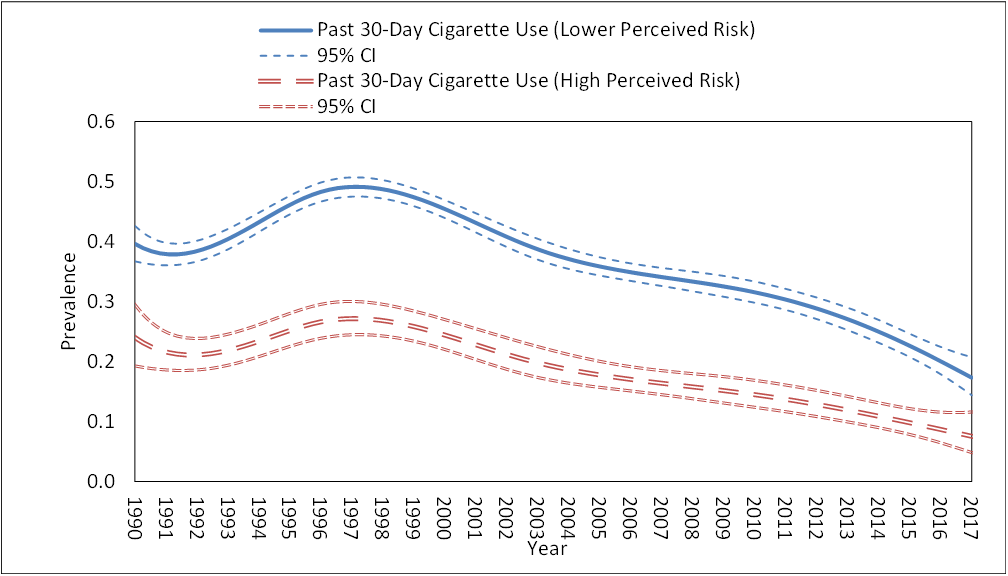
Figure 5.4b
Prevalence of past 30-day cigarette smoking (with 95% confidence band) for high school students with high and lower perceived risk of smoking as a function of historical time: 1990 – 2017.
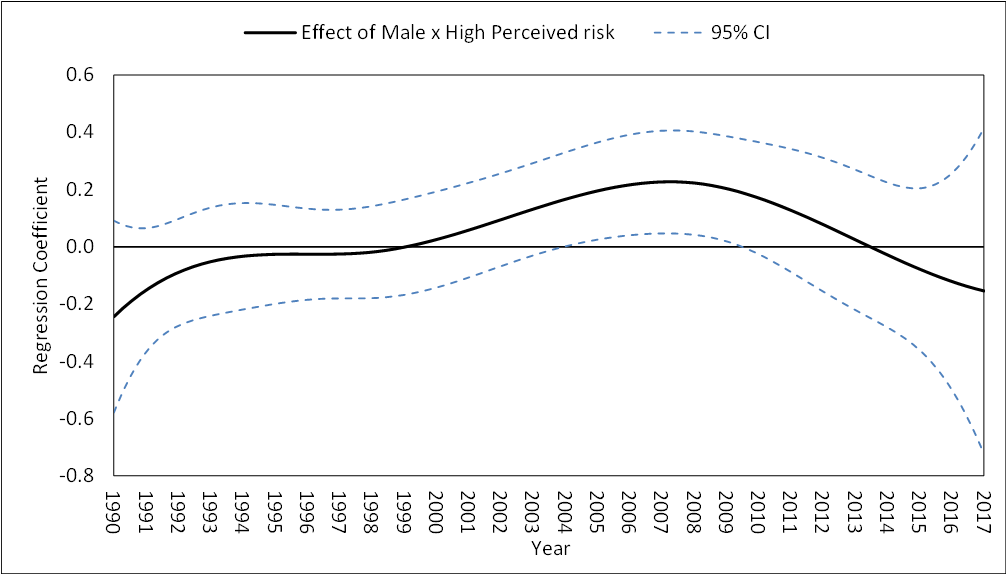
Figure 5.5a
Age-varying coefficient for the interaction between male and high perceived risk predicting past 30-day cigarette use.
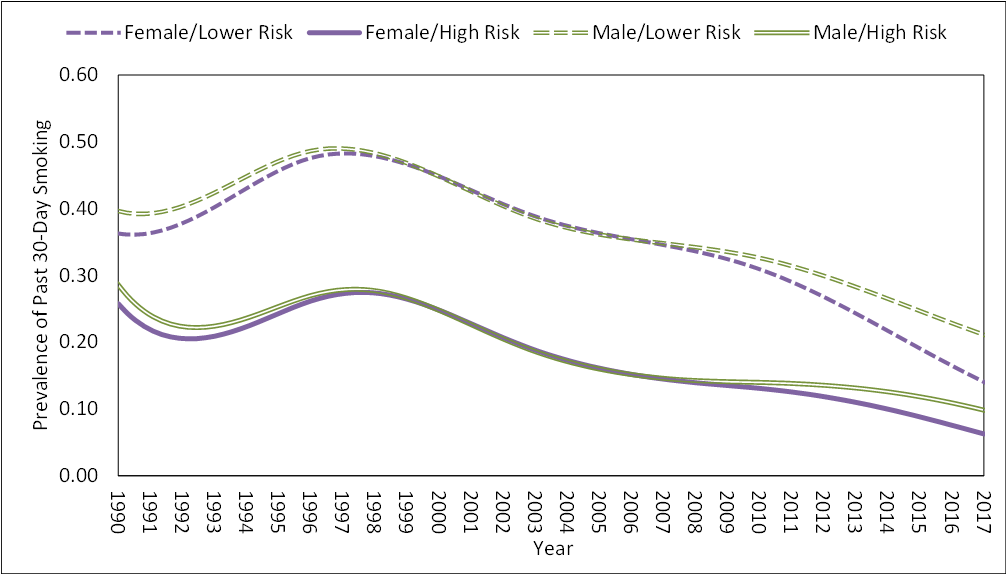
Figure 5.5b
Age-varying prevalences of past 30-day cigarette use among high school students given sex and perceived smoking risk as a function of historical time: 1990-2017.
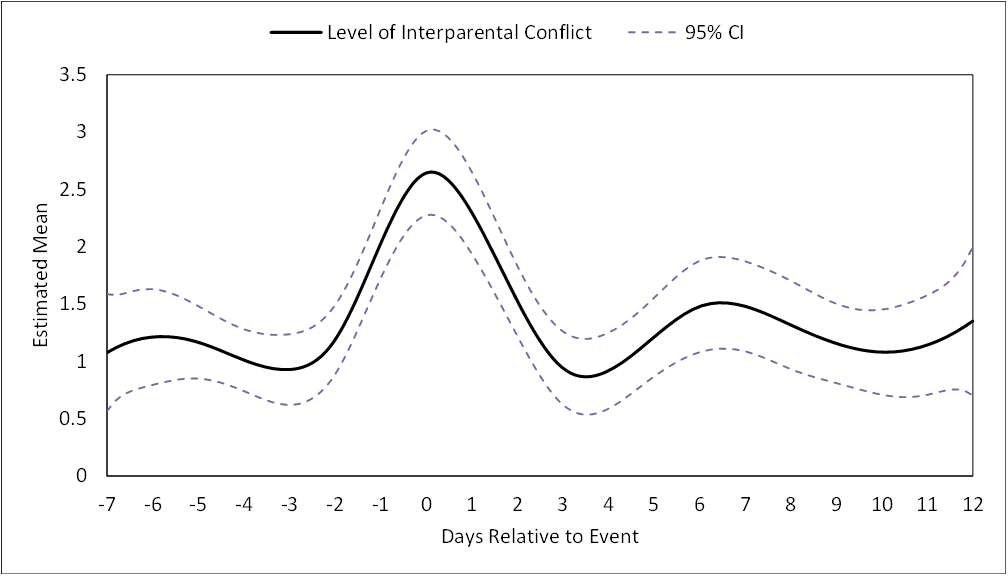
Figure 6.1
Estimated mean level of interparental conflict across days relative to a reported interparental conflict event (Day 0), without controlling for conflict experienced on other days.
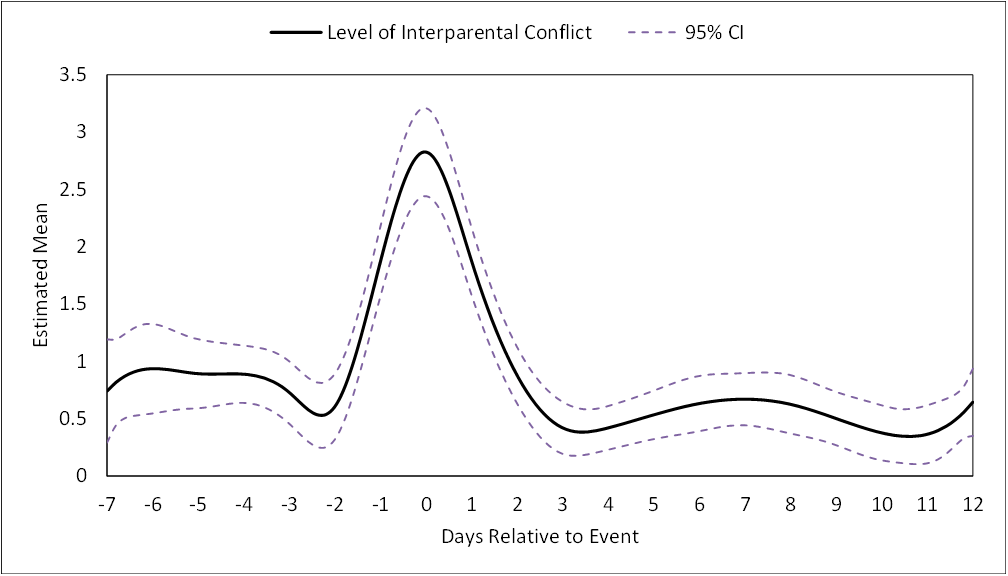
Figure 6.2
Estimated mean level of interparental conflict across days relative to a reported interparental conflict event.
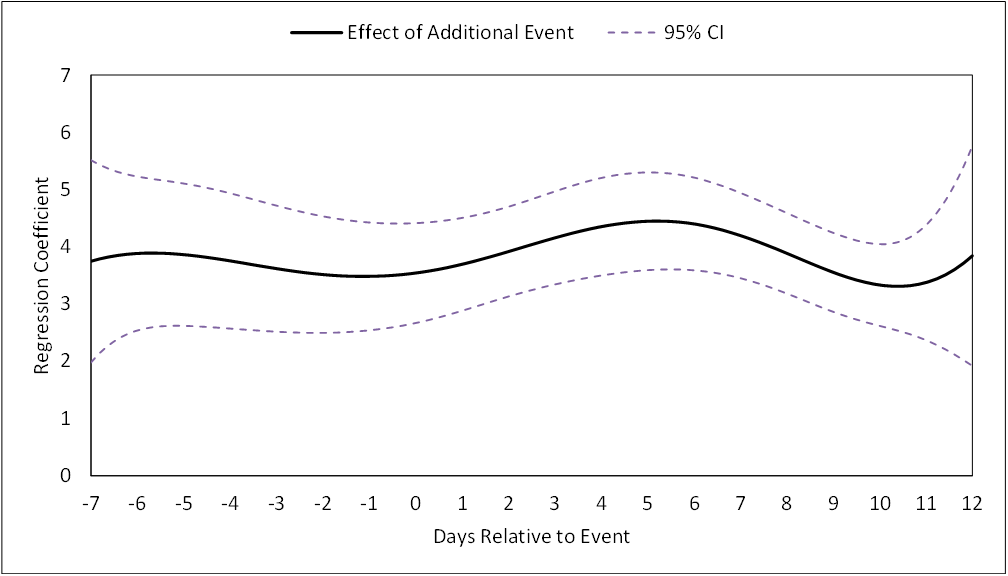
Figure 6.3
Coefficient function for the time-varying covariate indicating an additional conflict event
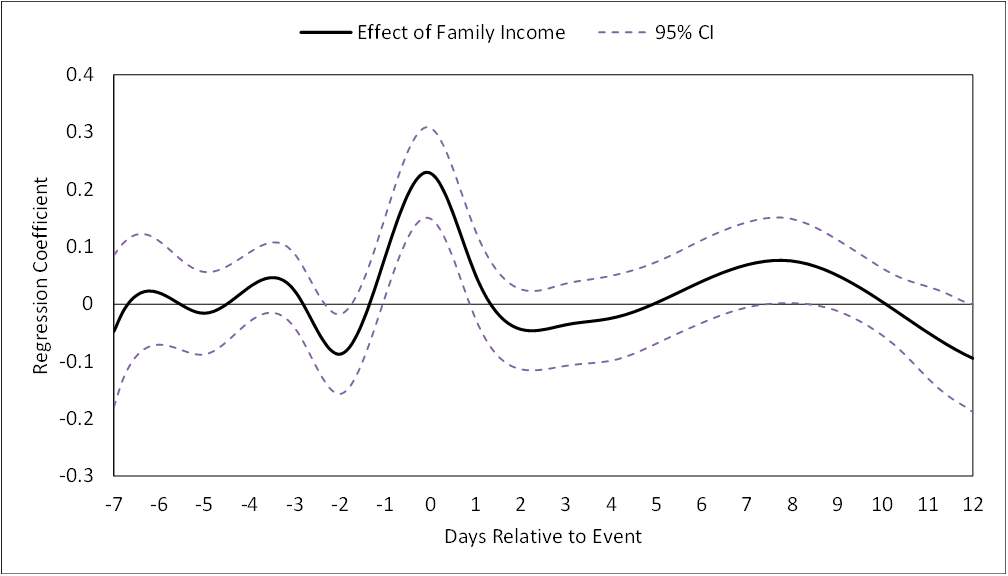
Figure 6.4
Time-varying association between baseline family income and level of interparental conflict across days relative to a conflict event (Day 0), controlling for conflict experienced on other days (with 95% confidence band).
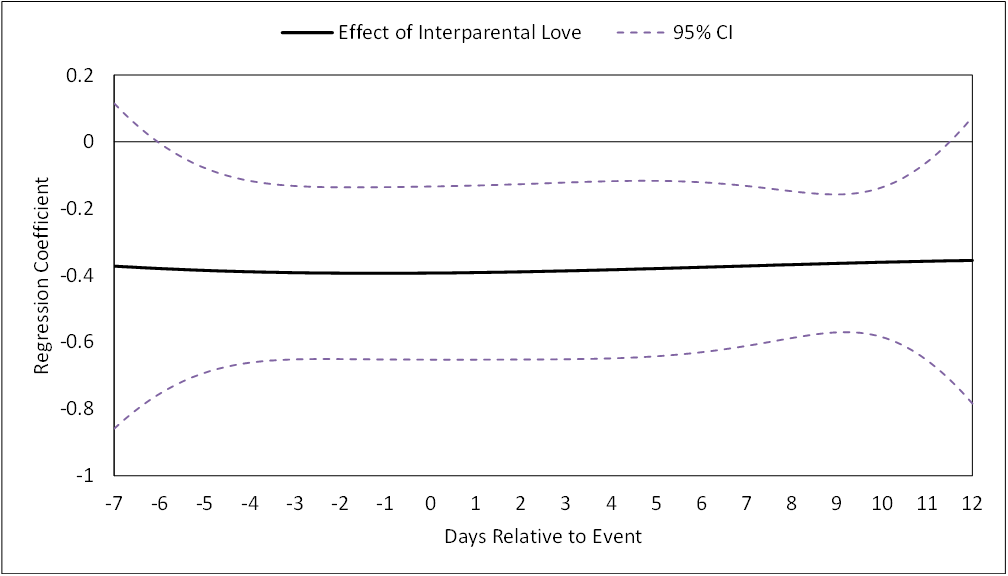
Figure 6.5
Time-varying association between baseline interparental love and level of interparental conflict across days relative to a conflict event (Day 0), controlling for conflict experienced on other days (with 95% confidence band).
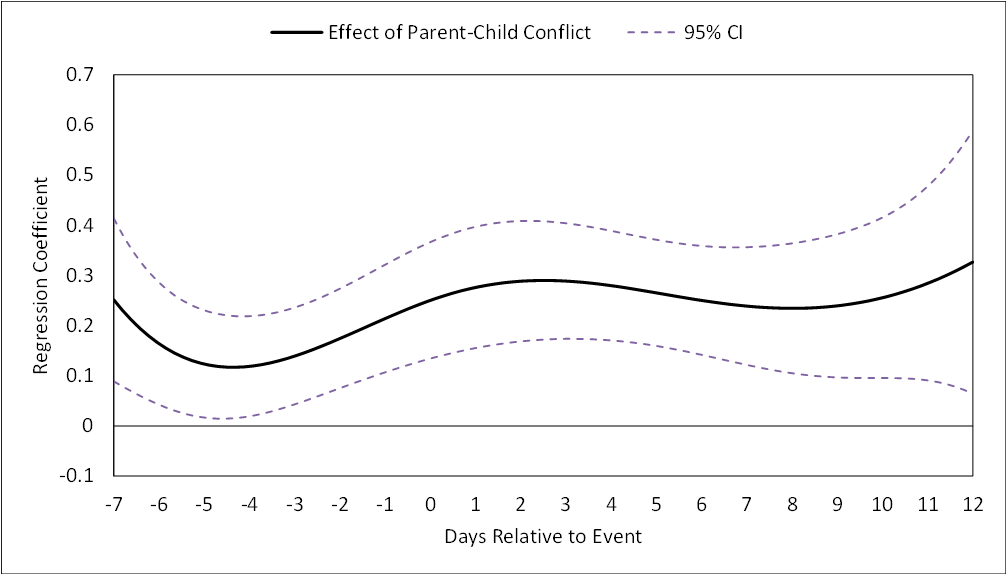
Figure 6.6
Time-varying association between daily parent-child conflict and level of interparental conflict across days relative to a conflict event (Day 0), controlling for conflict experienced on other days (with 95% confidence band).
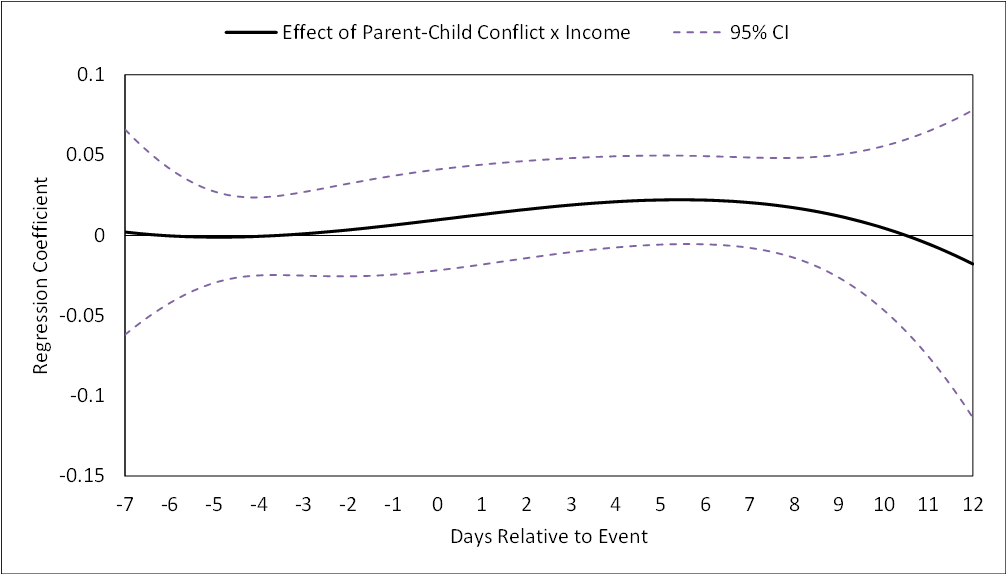
Figure 6.7
Effect of the interaction between parent-child conflict and family income on interparental conflict across days relative to a conflict event (Day 0), controlling for conflict experienced on other days (with 95% confidence band).
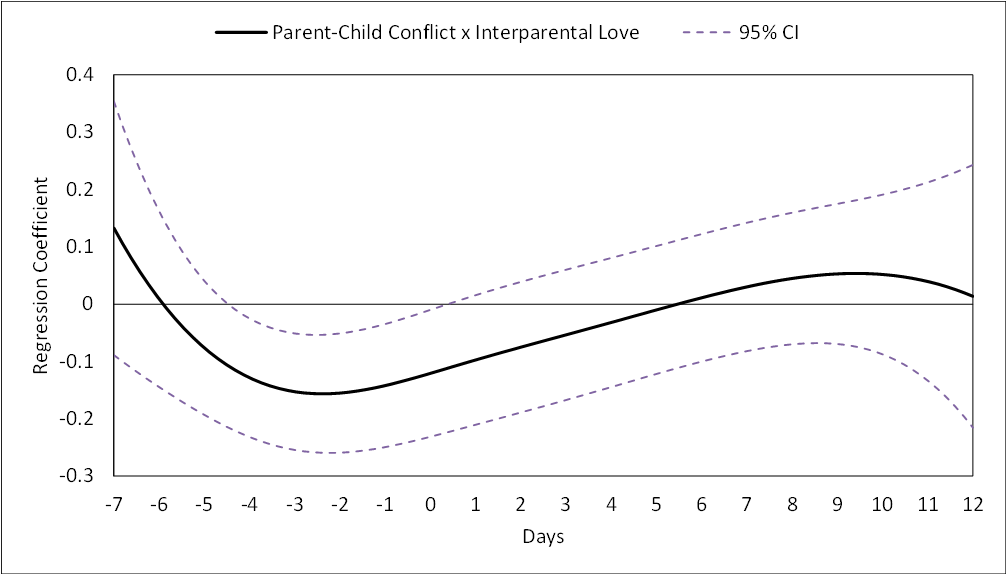
Figure 6.8a
Effect of the interaction between parent-child conflict and interparental love on interparental conflict, across days relative to a conflict event (Day 0), controlling for conflict experienced on other days (with 95% confidence band).
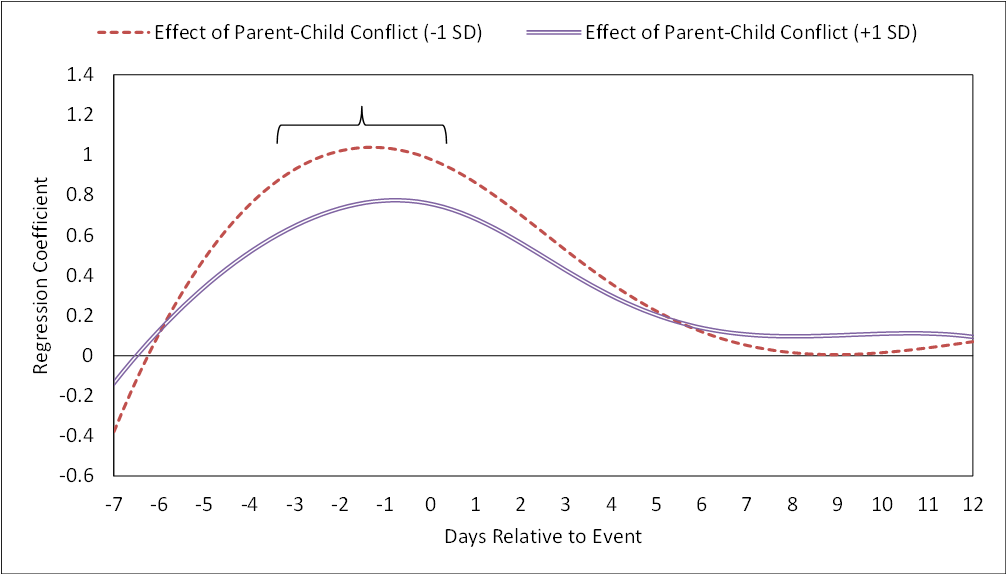
Figure 6.8b
Simple slopes for the association between parent-child conflict and interparental conflict across days, at higher (1 SD above mean level) and lower (1 SD below mean level) of interparental love, controlling for conflict experienced on...
Full Details